Posts

Showing posts with the label tutorial

Data Mining for Fund Raisers: How to Use Simple Statistics to Find the Gold in Your Donor Database Even If You Hate Statistics: A Starter Guide

Image
This is a repost of a Goodreads' review I made in 2013, for a book I read in 2005, which seems relevant now, as the industry is adding a data-driven focus. Plus, the world is now being transformed by advances in artificial intelligence and machine learning (AI/ML), particularly deep learning, and the large data sets and complexity of donor actions should greatly benefit from analysis. Note, the tax changes for 2018 and beyond will increase the importance of major donors, attenuating the benefits of AI/ML, as data for high-net-worth individuals is sparse. Data Mining for Fund Raisers: How to Use Simple Statistics to Find the Gold in Your Donor Database Even If You Hate Statistics: A Starter Guide by Peter B. Wylie My rating: 4 of 5 stars My spouse, at times a development researcher of high-net worth individuals, was given this book because she was the 'numbers' person in the office. Since my undergraduate was focused on lab-design, including analysis of results using ...

Review: Make Your Own Neural Network

Image
As part of understanding neural networks I was reading Make Your Own Neural Network by Tariq Rashid. A review is below: Make Your Own Neural Network by Tariq Rashid My rating: 4 of 5 stars The book itself can be painful to work through, as it is written for a novice, not just in algorithms and data analysis, but also in programming. For the neural network aspect, it jumped between overly simplistic and complicated, while providing neither in enough detail. That said, by the end I found it a worthwhile dive into neural networks, since once it got to the programming structure, it all made sense, but only because I stuck with it. View all my reviews

Comparing Performance in R Using Microbenchmark

Image
This post is a very simple display of how to use microbenchmark in R . Other sites might have longer and more detailed posts , but this post is primarily to 'spread the word' about this useful function, and show how to plot it. An alternative version of this post exists in Microsoft's Azure Notebooks, as Performance Testing Results with Microbenchmark Load Libraries Memoise as part of the code to test, microbenchmark to show usage, and ggplot2 to plot the result. library(memoise) library(microbenchmark) library(ggplot2) Create Functions Generate several functions with varied performance times, a base function plus functions that leverage vectorization and memoisation. # base function monte_carlo = function(N) { hits = 0 for (i in seq_len(N)) { u1 = runif(1) u2 = runif(1) if (u1 ^ 2 > u2) hits = hits + 1 } return(hits / N) } # memoise test function monte_carlo_memo <- memoise(mon...

Performance Improvements in R: Vectorization & Memoisation

Image
Full of potential coding improvements, Efficient R Programming: A Practical Guide to Smarter Programming , the book makes two suggestions that are notable. Vectorization, explained here and here , and memoisation , caching prior results albeit with additional memory use, were relevant and significant. What follows is a demonstration of the speed improvements that might be achieved using these concepts. ################################ # performance # vectorization and memoization ################################ # clear memory between changes rm(list = ls()) #load memoise #install.packages('memoise') library(memoise) # create test function monte_carlo = function(N) { hits = 0 for (i in seq_len(N)) { u1 = runif(1) u2 = runif(1) if (u1 ^ 2 > u2) hits = hits + 1 } return(hits / N) } # memoise test function monte_carlo_memo <- memoise(monte_carlo) # vectorize function monte_carlo...

Support Vector Machines on Big Five Traits and Politics

Image
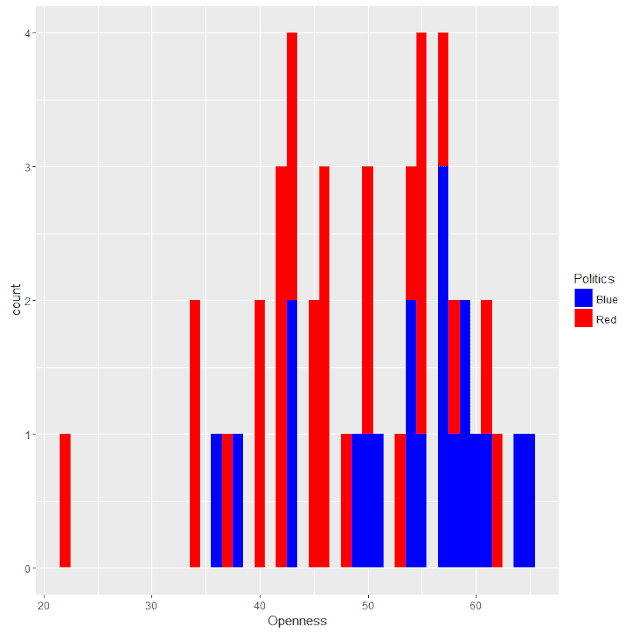
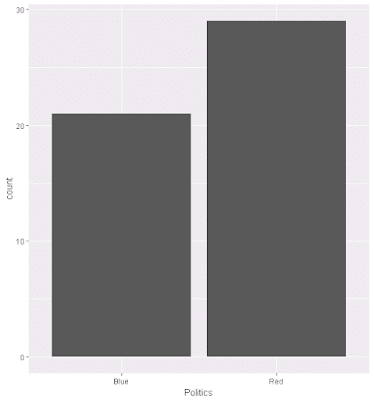
This is an example of Support Vector Machines, using one of my usual data sets, as part of a Pluralsight training presentation, Data Mining Algorithms in SSAS, Excel, and R . In terms of results, the prediction primarily predicts voter leanings based on two (2) traits, openness and conscientiousness, and although using all five (5) factors improved the prediction quality, plotting that is problematic. For this, the model is 96% predictive of Republican outcomes, but only 66% accurate in predicting Democratic leaning. Politics.prediction Blue Red Blue 15 1 Red 5 27 The code is below, as are some related graphs. Source data is here . # Clear memory rm(list = ls()) # set Working directory getwd() setwd('../Data') # load data Politics.df <- read.csv("BigFiveScoresByState.csv", na.strings = c("", "NA")) # clean data - remove NULLs Politics.df <- na.omit(Politic...

Charting Correlation Matrices in R

Image
I noticed this very simple, very powerful article by James Marquez, Seven Easy Graphs to Visualize Correlation Matrices in R , in the Google+ community, R Programming for Data Analysis , so thought to give it a try, since I started some of my current analyses a decade ago by generating correlation matrices in Excel, which I've sometimes redone and improved in R. Some of these packages are only designed for display, or as extensions to ggplot2: corrplot: Visualization of a Correlation Matrix GGally: Extension to 'ggplot2' ggcorrplot: Visualization of a Correlation Matrix using 'ggplot2' These two are focused on more complex analysis: PerformanceAnalytics: Econometric tools for performance and risk analysis psych: Procedures for Psychological, Psychometric, and Personality Research As for data, I used Hofstede's culture dimensions, limited to developed countries. Using a broader and larger set of of countries would significantly reduce the correlation...

Decision Trees (party) on Political Outcome Based on State-level Big Five Assessment

Image
This decision tree demo is similar to a prior one I've done, but in this case, it uses the party package, that produces much higher-quality graphics than rpart, at least when used with plot. Although the idea for this analysis is mine, this was done as part of work for a Pluralsight training presentation, Data Mining Algorithms in SSAS, Excel, and R . Source data is here . # # Load Data # # Set working directory setwd("../Data") getwd() # read from data frame BigFivByState.df <- read.table("BigFiveScoresByState.csv", header = TRUE, sep = ",") # # Run Analysis # # Load package, install.packages('party', dependencies = TRUE) library(party) # train the model BigFivByState.dt <- ctree(data = BigFivByState.df, Liberal ~ Openness + Conscientiousness + Extraversion + Neuroticism + Agreeableness) # plot result plot(BigFivByState.dt, uniform = TRUE, main = ...

Naive Bayes on Political Outcome Based on State-level Big Five Assessment

Image
As part of another Pluralsight training presentation, Data Mining Algorithms in SSAS, Excel, and R , I worked through various exercises, and from that I've adapated Naive Basyes to one of my existing data sets. The code is below, as are some related graphs. Overall, the percent correct predicted based on Big Five personality traits using the Naive Bayes calculation is 66%. Source data is here . # # Load & Explore Data # # read from data frame BigFivByState.df <- read.table("BigFiveScoresByState.csv", header = TRUE, sep = ",") # review data head(BigFivByState.df) nrow(BigFivByState.df) summary(BigFivByState.df) names(BigFivByState.df) # various aggregations # as "count this value" ~ grouped by this + this Liberal.dist <- aggregate(State ~ Liberal, data = BigFivByState.df, FUN = length) head(Liberal.dist) RedBlue.dist <- aggregate(State ~ Politics, data = BigFivByState.df, FU...

Plotting Text Frequency and Distribution using R for Spinoza's A Theological-Political Treatise [Part I]

Image
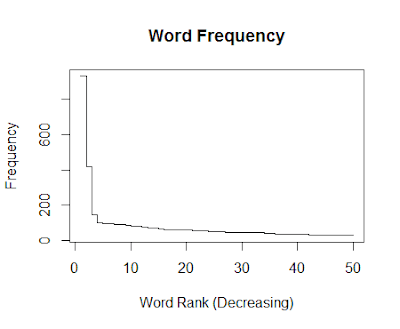
This was a little bit of fun, after reading a few more chapters of Text Analysis with R for Students of Literature . Spinoza is a current interest, as I am also reading Radical Enlightenment: Philosophy and the Making of Modernity 1650-1750 . Example Code (Common to Subsections) # Text for this can be acquired as below Project Gutenberg, as below # http://www.gutenberg.org/cache/epub/989/pg989.txt, # or via a Sample Data at the end of this post: textToRead = 'pg989.txt' # Text for this can be acquired via Matthew Jockers site, as below, # http://www.matthewjockers.net/macroanalysisbook/expanded-stopwords-list/, # or via a Sample Data at the end of this post: exclusionFile = 'StopList_Extended.csv' # Read Text text.scan <- scan(file = textToRead, what = 'char') text.scan <- tolower(text.scan) # Create list text.list <- strsplit(text.scan, '\\W+', perl = TRUE) text.vector <- unlist(text.list) # Create ...

Exercises: OESMN (Obtaining, Scrubbing, Exploring, Modeling, iNterpreting)

As part of the Data science is OSEMN module for Obtaining Data I worked through the exercises. Example Code # Exercises """http://people.duke.edu/~ccc14/sta-663/DataProcessingSolutions.html#exercises""" """1. Write the following sentences to a file “hello.txt” using open and write. There should be 3 lines in the resulting file. Hello, world. Goodbye, cruel world. The world is your oyster.""" str = 'Data\Test.txt' f = open(str, 'w') f.write('Hello, world.\r') f.write('Goodbye, cruel world.\r') f.write('The world is your oyster.') # Writes same thing, only in one statement f.write('\rHello, world.\rGoodbye, cruel world.\rThe world is your oyster.') f.close() with open(str, 'r') as f: content = f.read() print(content) """2. Using a for loop and open, print o...

A Better Tutorial: Computational Statistics in Python

Image
I was working through a tutorial in Python, but found this one, Computational Statistics in Python from Duke , much better. It has exercises, which increase retention, and the material is well-presented.