Posts

Showing posts with the label big five

Code: Pinterest as a Publication Channel for Data Analytics

Image
More as an experiment, rather an attempt at sharing code and ideas, I created a Pinterest board devoted to my personal data analytics work, done with Python, R, or F#, as well as reviews of books, and was quite surprised with the result. The graphics could do with optimization, but otherwise...

Neural Networks in R (Part 1 of 4) - Logistic Regression and neuralnet on State 'Personality' and Political Outcomes

Image
This is an example of neural networks using the neuralnet package on one of my sample data sets, walking through a Pluralsight training series, Data Mining Algorithms in SSAS, Excel, and R . In terms of results, the regression primarily predicts voter leanings based on five (5) traits, openness, conscientiousness, extraversion, agreeableness, and neuroticism, although only the first two (2) traits have a significant impact. Logistic regression is about 85% predictive, and slightly better at predicting Red states over its ability in predicting Blue states. [1] "Logistic Regression (All) - Correct (%) = 0.854166666666667" [1] "Logistic Regression (Red) - Correct (%) = 0.892857142857143" [1] "Logistic Regression (Blue) - Correct (%) = 0.8" For the neuralnet package, I created a loop to vary the hidden layers and the number of repetitions, since this is such a small number of records. This is obviously much less predictive than logistic regressi...

Support Vector Machines on Big Five Traits and Politics

Image
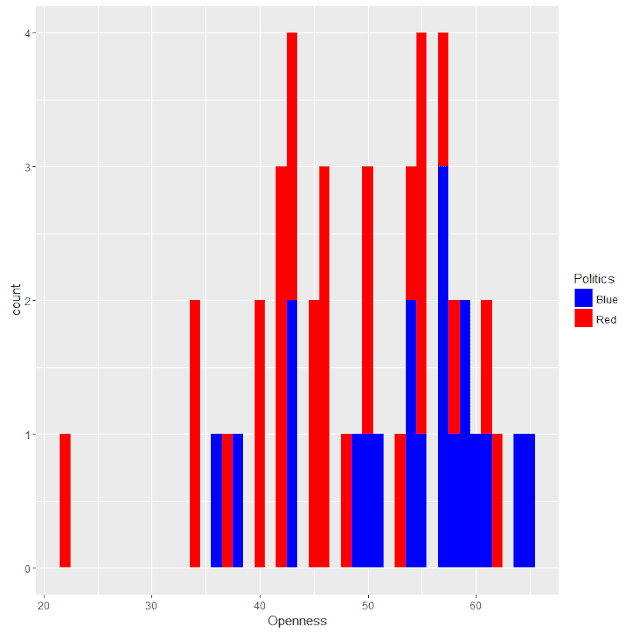
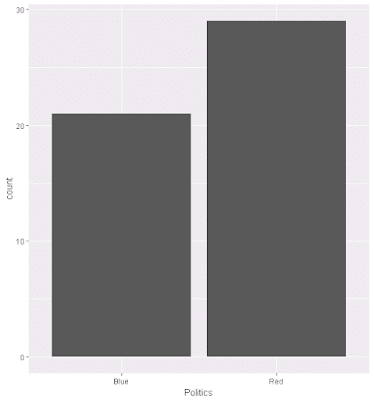
This is an example of Support Vector Machines, using one of my usual data sets, as part of a Pluralsight training presentation, Data Mining Algorithms in SSAS, Excel, and R . In terms of results, the prediction primarily predicts voter leanings based on two (2) traits, openness and conscientiousness, and although using all five (5) factors improved the prediction quality, plotting that is problematic. For this, the model is 96% predictive of Republican outcomes, but only 66% accurate in predicting Democratic leaning. Politics.prediction Blue Red Blue 15 1 Red 5 27 The code is below, as are some related graphs. Source data is here . # Clear memory rm(list = ls()) # set Working directory getwd() setwd('../Data') # load data Politics.df <- read.csv("BigFiveScoresByState.csv", na.strings = c("", "NA")) # clean data - remove NULLs Politics.df <- na.omit(Politic...

Charting Correlation Matrices in R

Image
I noticed this very simple, very powerful article by James Marquez, Seven Easy Graphs to Visualize Correlation Matrices in R , in the Google+ community, R Programming for Data Analysis , so thought to give it a try, since I started some of my current analyses a decade ago by generating correlation matrices in Excel, which I've sometimes redone and improved in R. Some of these packages are only designed for display, or as extensions to ggplot2: corrplot: Visualization of a Correlation Matrix GGally: Extension to 'ggplot2' ggcorrplot: Visualization of a Correlation Matrix using 'ggplot2' These two are focused on more complex analysis: PerformanceAnalytics: Econometric tools for performance and risk analysis psych: Procedures for Psychological, Psychometric, and Personality Research As for data, I used Hofstede's culture dimensions, limited to developed countries. Using a broader and larger set of of countries would significantly reduce the correlation...

Decision Trees (party) on Political Outcome Based on State-level Big Five Assessment

Image
This decision tree demo is similar to a prior one I've done, but in this case, it uses the party package, that produces much higher-quality graphics than rpart, at least when used with plot. Although the idea for this analysis is mine, this was done as part of work for a Pluralsight training presentation, Data Mining Algorithms in SSAS, Excel, and R . Source data is here . # # Load Data # # Set working directory setwd("../Data") getwd() # read from data frame BigFivByState.df <- read.table("BigFiveScoresByState.csv", header = TRUE, sep = ",") # # Run Analysis # # Load package, install.packages('party', dependencies = TRUE) library(party) # train the model BigFivByState.dt <- ctree(data = BigFivByState.df, Liberal ~ Openness + Conscientiousness + Extraversion + Neuroticism + Agreeableness) # plot result plot(BigFivByState.dt, uniform = TRUE, main = ...

Naive Bayes on Political Outcome Based on State-level Big Five Assessment

Image
As part of another Pluralsight training presentation, Data Mining Algorithms in SSAS, Excel, and R , I worked through various exercises, and from that I've adapated Naive Basyes to one of my existing data sets. The code is below, as are some related graphs. Overall, the percent correct predicted based on Big Five personality traits using the Naive Bayes calculation is 66%. Source data is here . # # Load & Explore Data # # read from data frame BigFivByState.df <- read.table("BigFiveScoresByState.csv", header = TRUE, sep = ",") # review data head(BigFivByState.df) nrow(BigFivByState.df) summary(BigFivByState.df) names(BigFivByState.df) # various aggregations # as "count this value" ~ grouped by this + this Liberal.dist <- aggregate(State ~ Liberal, data = BigFivByState.df, FUN = length) head(Liberal.dist) RedBlue.dist <- aggregate(State ~ Politics, data = BigFivByState.df, FU...

Decision Tree in R, with Graphs: Predicting State Politics from Big Five Traits

Image
This was a continuation of prior explorations, logistic regression predicting Red/Blue state dichotomy by income or by personality. This uses the same five personality dimensions, but instead builds a decision tree. Of the Big Five traits, only two were found to useful in the decision tree, conscientiousness and openness. Links to sample data, as well as to source references, are at the end of this entry. Example Code # Decision Tree - Big Five and Politics library("rpart") # grow tree input.dat <- read.table("BigFiveScoresByState.csv", header = TRUE, sep = ",") fit <- rpart(Liberal ~ Openness + Conscientiousness + Neuroticism + Extraversion + Agreeableness, data = input.dat, method="poisson") # display the results printcp(fit) # visualize cross-validation results plotcp(fit) # detailed summary of splits summary(fit) # plot tree plot(fit, uniform = TRUE, main = "Class...