Posts

Showing posts with the label plot

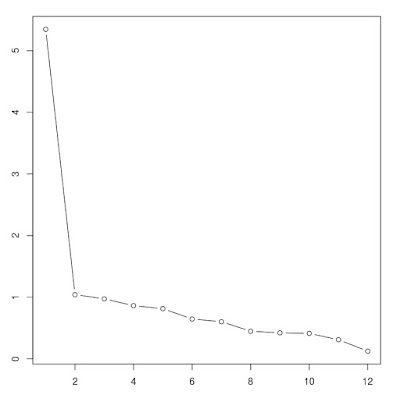
Principal Component Analysis (PCA) on Stock Returns in R
Image
Principal Component Analysis Principal Component Analysis is a statistical process that distills measurement variation into vectors with greater ability to predict outcomes utilizing a process of scaling, covariance, and eigendecomposition. MS Azure Notebook The work for this is done in the following notebook, Principal Component Analysis (PCA) on Stock Returns in R , with detailed code, output, and charts. An outline of the notebook contents are below. Overview of Demonstration Supporting Material Pluralsight Explained Visually Wikipedia Load Data: Format Data & Sort Prep Data: Create Returns Generate Principal Components Eigen Decomposition and Scree Plot Create Principal Components Analysis FVX using PCA versus Logistic Regression Alternative Libraries: Psych for the Social Sciences

Value-at-Risk (VaR) Calculator Class in Python

Image
As part of my self-development, I wanted to rework a script, which are typically one-offs, and turn it into a reusable component, although there are existing packages for VaR. As such, this is currently a work in progress. This code is a Python-based class for VaR calculations , and for those unfamiliar with VaR, it is an acronym for value at risk, the worst case loss in a period for a particular probability. It is a reworking of prior work with scripted VaR calculations , implementing various high-level good practices, e.g., hiding/encapsulation, do-not-repeat-yourself (DRY), dependency injection, etc. Features: Requires data frame of stock returns, factor returns, and stock weights Expose a method to calculate and return a single VaR number for different variance types Expose a method to calculate and return an array of VaR values by confidence level Expose a method to calculate and plot an array of VaR values by confidence level Still to do: Dynamic factor usage Note...

Comparing Performance in R Using Microbenchmark

Image
This post is a very simple display of how to use microbenchmark in R . Other sites might have longer and more detailed posts , but this post is primarily to 'spread the word' about this useful function, and show how to plot it. An alternative version of this post exists in Microsoft's Azure Notebooks, as Performance Testing Results with Microbenchmark Load Libraries Memoise as part of the code to test, microbenchmark to show usage, and ggplot2 to plot the result. library(memoise) library(microbenchmark) library(ggplot2) Create Functions Generate several functions with varied performance times, a base function plus functions that leverage vectorization and memoisation. # base function monte_carlo = function(N) { hits = 0 for (i in seq_len(N)) { u1 = runif(1) u2 = runif(1) if (u1 ^ 2 > u2) hits = hits + 1 } return(hits / N) } # memoise test function monte_carlo_memo <- memoise(mon...

ARIMA,Time Series, and Charting in R

Image
ARIMA is an acronym for Autoregressive Integrated Moving Average, and one explanation describes ARIMA models as... ...another approach to time series forecasting. Exponential smoothing and ARIMA models are the two most widely-used approaches to time series forecasting, and provide complementary approaches to the problem. While exponential smoothing models were based on a description of trend and seasonality in the data, ARIMA models aim to describe the autocorrelations in the data. A detailed technical discussion can be found on Wikipedia. For the first exploration I developed several ARIMA models using financial data, varying the parameters, noted as P, D and Q. A general overview of the parameters is from Wikipedia: p is the order (number of time lags) of the autoregressive model d is the degree of differencing (the number of times the data have had past values subtracted) q is the order of the moving-average model # filtered to start on a date Portfolio.filtere...

Inequality and Religiosity: The Gini ~ Religion Matters Vector, with Correlations and Plot

Image
Responses to a post on the correlation between country-average IQ and responding yes to a question on if religion matters are inversely correlated, but not strongly so, prompted me to dig up a more significant issue, the relationship between religiosity and inequality, as measured by the Gini coefficient. The correlation is quite high, at about .7, although this really says nothing about the cause, if religious countries tend toward inequality because of general tendencies, or if inequality drives people to religion, as a salve against suffering. In truth, they could both be reflective of some other aspect of a country, and not in any way causative. Example Code # Correlations on ReligionMatters and Gini Coeficients oecdData <- read.table("OECD - Quality of Life.csv", header = TRUE, sep = ",") #names(oecdData) religionMattersVector <- oecdData$ReligionMatters giniVector <- oecdData$Gini cor.test(giniVector, religionMattersVect...