Posts

Showing posts with the label charting

My Most Popular Posts of 2017

Image
Although I've made many posts on my Data Analytics Workouts site, some generated more interest than others - nothing here was virally popular - and below are a handful of the most popular, sorted in descending order of views: Charting Correlation Matrices in R (877) Neural Networks (Part 4 of 4) - R Packages and Resources (507) Performance Improvements in R: Vectorization & Memoisation (322) Naive Bayes on Political Outcome Based on State-level Big Five Assessment (263) Decision Trees on Political Outcome Based on State-level Big Five Assessment (262) F# is Part of Microsoft's Data Science Workloads (223) Logistic Regression on Stock Data using Google and SPY (SPDR S&P 500) (196) Using Visual Studio Team Services for Personal Development (194) Microsoft Azure Notebooks - Live code - F#, R, and Python (186) Efficient R Programming - A Quick Review (178) Patents Per Capita and Hofstede's Cultural Dimensions (167) Comparing Performance in R Usin...
Neural Networks (Part 4 of 4) - R Packages and Resources

Image
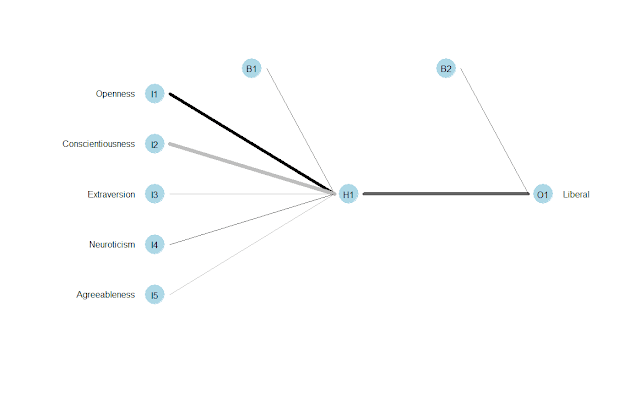
While developing these demonstrations in logistic regression and neural networks, I used and discovered some interesting methods and techniques: Better Methods A few useful commands and packages...: update.packages() for updating installed packages in one easy action as.formula() for creating a formula that I can reuse and update in one action across all my code sections View() for looking at data frames fourfoldplot() for plotting confusion matrices neuralnet for developing neural networks caret , used with nnet , to create predictive model plotnet() in NeuralNetTools, for creating attractive neural network models Resources that I used or that I would like to explore... MS Azure Notebooks , for working online with Python, R, and F#, all part of MS's data workflows Efficient R Programming , that seems to have many good tips on working with R Data Mining Algorithms in SSAS, Excel, and R , showing various algorithms in each technology R Documentation , a ...

Neural Networks in R (Part 1 of 4) - Logistic Regression and neuralnet on State 'Personality' and Political Outcomes

Image
This is an example of neural networks using the neuralnet package on one of my sample data sets, walking through a Pluralsight training series, Data Mining Algorithms in SSAS, Excel, and R . In terms of results, the regression primarily predicts voter leanings based on five (5) traits, openness, conscientiousness, extraversion, agreeableness, and neuroticism, although only the first two (2) traits have a significant impact. Logistic regression is about 85% predictive, and slightly better at predicting Red states over its ability in predicting Blue states. [1] "Logistic Regression (All) - Correct (%) = 0.854166666666667" [1] "Logistic Regression (Red) - Correct (%) = 0.892857142857143" [1] "Logistic Regression (Blue) - Correct (%) = 0.8" For the neuralnet package, I created a loop to vary the hidden layers and the number of repetitions, since this is such a small number of records. This is obviously much less predictive than logistic regressi...

Support Vector Machines on Big Five Traits and Politics

Image
This is an example of Support Vector Machines, using one of my usual data sets, as part of a Pluralsight training presentation, Data Mining Algorithms in SSAS, Excel, and R . In terms of results, the prediction primarily predicts voter leanings based on two (2) traits, openness and conscientiousness, and although using all five (5) factors improved the prediction quality, plotting that is problematic. For this, the model is 96% predictive of Republican outcomes, but only 66% accurate in predicting Democratic leaning. Politics.prediction Blue Red Blue 15 1 Red 5 27 The code is below, as are some related graphs. Source data is here . # Clear memory rm(list = ls()) # set Working directory getwd() setwd('../Data') # load data Politics.df <- read.csv("BigFiveScoresByState.csv", na.strings = c("", "NA")) # clean data - remove NULLs Politics.df <- na.omit(Politic...

Charting Correlation Matrices in R

Image
I noticed this very simple, very powerful article by James Marquez, Seven Easy Graphs to Visualize Correlation Matrices in R , in the Google+ community, R Programming for Data Analysis , so thought to give it a try, since I started some of my current analyses a decade ago by generating correlation matrices in Excel, which I've sometimes redone and improved in R. Some of these packages are only designed for display, or as extensions to ggplot2: corrplot: Visualization of a Correlation Matrix GGally: Extension to 'ggplot2' ggcorrplot: Visualization of a Correlation Matrix using 'ggplot2' These two are focused on more complex analysis: PerformanceAnalytics: Econometric tools for performance and risk analysis psych: Procedures for Psychological, Psychometric, and Personality Research As for data, I used Hofstede's culture dimensions, limited to developed countries. Using a broader and larger set of of countries would significantly reduce the correlation...