Posts

Showing posts with the label ggplot

Comparing Performance in R Using Microbenchmark

Image
This post is a very simple display of how to use microbenchmark in R . Other sites might have longer and more detailed posts , but this post is primarily to 'spread the word' about this useful function, and show how to plot it. An alternative version of this post exists in Microsoft's Azure Notebooks, as Performance Testing Results with Microbenchmark Load Libraries Memoise as part of the code to test, microbenchmark to show usage, and ggplot2 to plot the result. library(memoise) library(microbenchmark) library(ggplot2) Create Functions Generate several functions with varied performance times, a base function plus functions that leverage vectorization and memoisation. # base function monte_carlo = function(N) { hits = 0 for (i in seq_len(N)) { u1 = runif(1) u2 = runif(1) if (u1 ^ 2 > u2) hits = hits + 1 } return(hits / N) } # memoise test function monte_carlo_memo <- memoise(mon...

Neural Networks in R (Part 1 of 4) - Logistic Regression and neuralnet on State 'Personality' and Political Outcomes

Image
This is an example of neural networks using the neuralnet package on one of my sample data sets, walking through a Pluralsight training series, Data Mining Algorithms in SSAS, Excel, and R . In terms of results, the regression primarily predicts voter leanings based on five (5) traits, openness, conscientiousness, extraversion, agreeableness, and neuroticism, although only the first two (2) traits have a significant impact. Logistic regression is about 85% predictive, and slightly better at predicting Red states over its ability in predicting Blue states. [1] "Logistic Regression (All) - Correct (%) = 0.854166666666667" [1] "Logistic Regression (Red) - Correct (%) = 0.892857142857143" [1] "Logistic Regression (Blue) - Correct (%) = 0.8" For the neuralnet package, I created a loop to vary the hidden layers and the number of repetitions, since this is such a small number of records. This is obviously much less predictive than logistic regressi...

Decision Trees (party) on Political Outcome Based on State-level Big Five Assessment

Image
This decision tree demo is similar to a prior one I've done, but in this case, it uses the party package, that produces much higher-quality graphics than rpart, at least when used with plot. Although the idea for this analysis is mine, this was done as part of work for a Pluralsight training presentation, Data Mining Algorithms in SSAS, Excel, and R . Source data is here . # # Load Data # # Set working directory setwd("../Data") getwd() # read from data frame BigFivByState.df <- read.table("BigFiveScoresByState.csv", header = TRUE, sep = ",") # # Run Analysis # # Load package, install.packages('party', dependencies = TRUE) library(party) # train the model BigFivByState.dt <- ctree(data = BigFivByState.df, Liberal ~ Openness + Conscientiousness + Extraversion + Neuroticism + Agreeableness) # plot result plot(BigFivByState.dt, uniform = TRUE, main = ...

Naive Bayes on Political Outcome Based on State-level Big Five Assessment

Image
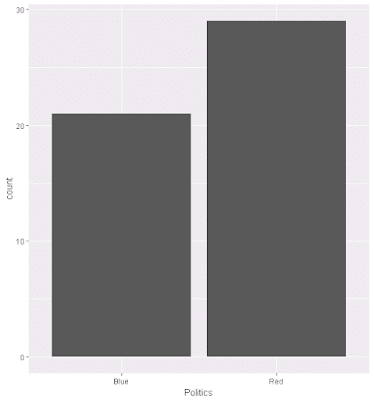
As part of another Pluralsight training presentation, Data Mining Algorithms in SSAS, Excel, and R , I worked through various exercises, and from that I've adapated Naive Basyes to one of my existing data sets. The code is below, as are some related graphs. Overall, the percent correct predicted based on Big Five personality traits using the Naive Bayes calculation is 66%. Source data is here . # # Load & Explore Data # # read from data frame BigFivByState.df <- read.table("BigFiveScoresByState.csv", header = TRUE, sep = ",") # review data head(BigFivByState.df) nrow(BigFivByState.df) summary(BigFivByState.df) names(BigFivByState.df) # various aggregations # as "count this value" ~ grouped by this + this Liberal.dist <- aggregate(State ~ Liberal, data = BigFivByState.df, FUN = length) head(Liberal.dist) RedBlue.dist <- aggregate(State ~ Politics, data = BigFivByState.df, FU...