Posts

Showing posts from June, 2017

Basic Three Layer Neural Network in Python
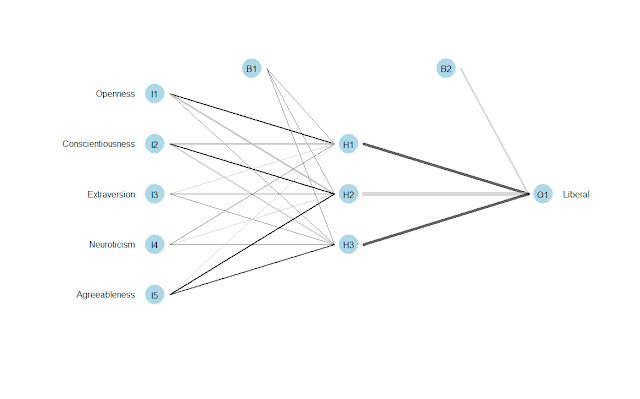
Image
Introduction As part of understanding neural networks I was reading Make Your Own Neural Network by Tariq Rashid. The book itself can be painful to work through, as it is written for a novice, not just in algorithms and data analysis, but also in programming. Although the code is a verbatim transcription from the text (see Source section), I published it to better understand how neural networks are designed, made easy by the use of a Jupyter Notebook, not to present this as my own work, although I do hope that this helps others develop their talents with data analytics.  Github Source:  AzureNotebooks/Basic Three Layer Neural Network in Python.ipynb at master · JamesIgoe/AzureNotebooks (github.com) Overview The code itself develops as follows: Constructor set number of nodes in each input, hidden, output layer link weight matrices, wih and who weights inside the arrays are w_i_j, where link is from node i to node j in the next layer set learning rate activat...

Clustering: Hierarchical and K-Means in R on Hofstede Cultural Patterns

Image
Overview What follows is an exploration of clustering, via hierarchies and K-Means, using the Hofstede patterns data, available from my Public folder . For a deeper understanding of clustering and the various related techniques I suggest the following: Cluster analysis (Wikipedia) An Introduction to Clustering and different methods of clustering Load Data # load data Hofstede.df.preclean <- read.csv("HofstedePatterns.csv", na.strings = c("", "NA")) #nrow(Hofstede.df.preclean) # remove NULLs Hofstede.df.preclean <- na.omit(Hofstede.df.preclean) #nrow(Hofstede.df.preclean) Hofstede.df <- Hofstede.df.preclean Hierarchical Clustering Run hclust, Generate Dendrogram The first attempt is the simplest analysis using the dist() and hclust() functions to generate a hierarchy of grouped data. The cluster size is derived from a reading of the dendrogram, although there are automated ways of selecting the cluster ...

F# is Part of Microsoft's Data Science Workloads

Image
I have not worked in F# for over two (2) years, but am enthused that Microsoft has added it to it languages for Data Science Workloads, along with R and Python. To that end, I hope to repost some of my existing F# code, as well as explore Data Science Workloads utilizing all three languages. Prior work in F# is available from learning F# , and some solutions will be republished on this site. Data Science Workloads Build Intelligent Apps Faster with Visual Studio and the Data Science Workload Published Work in F# James Igoe MS Azure Notebooks that utilizes MS's implementation of Jupyter Notesbooks . Mathematical Library, a basic mathematical NuGet package, with the source hosted on GitHub . Basic Statistical Functions: Very basic F# class for performing standard deviation and variance calculations. Various Number Functions: A collection of basic mathematical functions written in F# as part of my learning via Project Euler, functions for creating arrays or calc...

Comparing Performance in R Using Microbenchmark

Image
This post is a very simple display of how to use microbenchmark in R . Other sites might have longer and more detailed posts , but this post is primarily to 'spread the word' about this useful function, and show how to plot it. An alternative version of this post exists in Microsoft's Azure Notebooks, as Performance Testing Results with Microbenchmark Load Libraries Memoise as part of the code to test, microbenchmark to show usage, and ggplot2 to plot the result. library(memoise) library(microbenchmark) library(ggplot2) Create Functions Generate several functions with varied performance times, a base function plus functions that leverage vectorization and memoisation. # base function monte_carlo = function(N) { hits = 0 for (i in seq_len(N)) { u1 = runif(1) u2 = runif(1) if (u1 ^ 2 > u2) hits = hits + 1 } return(hits / N) } # memoise test function monte_carlo_memo <- memoise(mon...

Pluralsight Courses - Opinion

My list is kind of paltry, but I’ve sat through others or started many but decided against finishing. The best courses I’ve finished have been along the lines of project management: Project Management for Software Engineers Project 2013 Fundamentals for Business Professionals I’ve also sat through this, and useful, although very rudimentary: Creating and Leading Effective Teams for Managers I do my own reading for data science, and have my own side projects, but I’ve also taken some data science courses via Pluralsight. The beginner demos are done well, although less informative than the intermediate ones, which are ultimately more useful. For the latter, I typically do simultaneous coding on my own data sets, which helps learn the material. Beginner Understanding Machine Learning Understanding Machine Learning with R Intermediate Understanding and Applying Logistic Regression (using Excel, Python, or R) Data Mining Algorithms in SSAS, Excel, and R ...

ARIMA,Time Series, and Charting in R

Image
ARIMA is an acronym for Autoregressive Integrated Moving Average, and one explanation describes ARIMA models as... ...another approach to time series forecasting. Exponential smoothing and ARIMA models are the two most widely-used approaches to time series forecasting, and provide complementary approaches to the problem. While exponential smoothing models were based on a description of trend and seasonality in the data, ARIMA models aim to describe the autocorrelations in the data. A detailed technical discussion can be found on Wikipedia. For the first exploration I developed several ARIMA models using financial data, varying the parameters, noted as P, D and Q. A general overview of the parameters is from Wikipedia: p is the order (number of time lags) of the autoregressive model d is the degree of differencing (the number of times the data have had past values subtracted) q is the order of the moving-average model # filtered to start on a date Portfolio.filtere...