Neural Networks in R (Part 2 of 4) - caret and nnet on State 'Personality' and Political Outcomes
This is a continuation of a prior post, Neural Networks (Part 1 of 4) - Logistic Regression and neuralnet on State 'Personality' and Political Outcomes, the second in a series exploring neural networks.
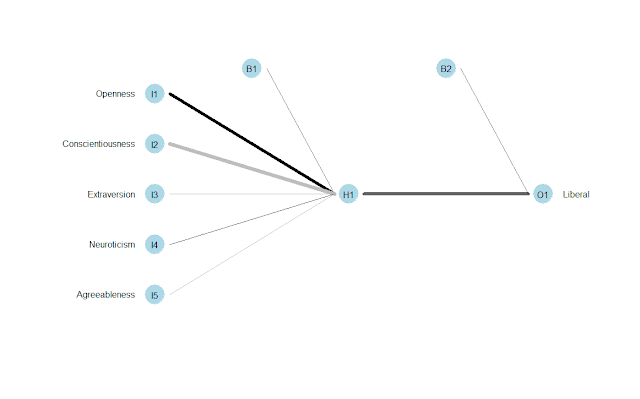
This post is a demonstration using the caret and nnet packages on aggregate Big Five traits per state and political leanings. Given the small sample size, there was a lower predictive ability using the train/test scenario using 80%, around .66, versus the entire set, which was correct at .83. This is evident in the graphs using lm() and stat_smoot().
The code is below, as are some related graphs. Source data is here.
 ################################################
 # Neural Net with nnet and caret
 ################################################

 # load packages
 library(nnet)
 library(caret)

 # train
 Politics.model <- train(equation, Politics.df, method = 'nnet', linout = TRUE, trace = FALSE)
 Politics.model.predicted <- predict(Politics.model, Politics.df)

 # classification result
 #plot(Politics.model.predicted)

 Politics.model.combined <- cbind(Politics.model.predicted, Politics.df)
 #View(Politics.model.combined)

 # percent correct using nnet & caret
 Politics.model.combined$predictionBinary <- ifelse(Politics.model.combined$Politics.model.predicted > .5, 1, 0)
 Politics.model.combined$Correct <- ifelse(Politics.model.combined$predictionBinary == Politics.model.combined$Liberal, 1, 0)
 (Correct.nnet <- paste("caret using nnet - Correct (%) = ", (sum(Politics.model.combined$Correct) / length(Politics.model.combined$Correct))))

 # display neural net model
 # install.packages('NeuraNetTools')
 library(NeuralNetTools)
 plotnet(Politics.model, alpha = 0.6)


# graph log regression
 library(ggplot2)
 plotPart1 <- ggplot(data = Politics.model.combined, aes(y = Politics.model.predicted, x = Liberal))
 plotPart1 + geom_point() + stat_smooth(method = "lm", formula = y ~ x, size = 2)


################################################
 # Neural Net with nnet and caret
 # Train / Test scenario
 ################################################

 # traing and testing a model
 Politics.training <- createDataPartition(y = Politics.df$Liberal, p = 0.8, list = FALSE)

 train.set <- Politics.df[Politics.training,]
 test.set <- Politics.df[ - Politics.training,]
 nrow(train.set) / nrow(test.set) # should be around 4

 Politics.training.model <- train(equation, train.set, method = "nnet", trace = FALSE)
 Politics.training.prediction <- predict(Politics.training.model, test.set)

 Politics.training.combined <- as.data.frame(cbind(Politics.training.prediction, test.set))
 # View(Politics.training.combined)

 # percent correct for test set
 # percent correct using nnet & caret
 Politics.training.combined$predictionBinary <- ifelse(Politics.training.combined$Politics.training.prediction > .5, 1, 0)
 Politics.training.combined$Correct <- ifelse(Politics.training.combined$predictionBinary == Politics.training.combined$Liberal, 1, 0)
 (Correct.test <- paste("caret using nnet (Test/Train) - Correct (%) = ", (sum(Politics.training.combined$Correct) / length(Politics.training.combined$Correct))))

 # display neural net model
 # install.packages('NeuraNetTools')
 library(NeuralNetTools)
 plotnet(Politics.training.model, alpha = 0.6)


# graph result, prediction versus actual, and add linear model line
 library(ggplot2)
 plotPart1 <- ggplot(data = Politics.training.combined, aes(y = Politics.training.prediction, x = Liberal))
 plotPart1 + geom_point() + stat_smooth(method = "lm", formula = y ~ x, size = 2)


Comments
Post a Comment