Support Vector Machines on Big Five Traits and Politics
This is an example of Support Vector Machines, using one of my usual data sets, as part of a Pluralsight training presentation, Data Mining Algorithms in SSAS, Excel, and R.
In terms of results, the prediction primarily predicts voter leanings based on two (2) traits, openness and conscientiousness, and although using all five (5) factors improved the prediction quality, plotting that is problematic. For this, the model is 96% predictive of Republican outcomes, but only 66% accurate in predicting Democratic leaning.
In terms of results, the prediction primarily predicts voter leanings based on two (2) traits, openness and conscientiousness, and although using all five (5) factors improved the prediction quality, plotting that is problematic. For this, the model is 96% predictive of Republican outcomes, but only 66% accurate in predicting Democratic leaning.
 Politics.prediction  Blue Red
                Blue   15   1
                 Red    5  27
# Clear memory
rm(list = ls())
# set Working directory
getwd()
setwd('../Data')
# load data
Politics.df <- read.csv("BigFiveScoresByState.csv", na.strings = c("", "NA"))
# clean data - remove NULLs
Politics.df <- na.omit(Politics.df)
# explore data #1 - str shows type, more useful in some instances than summary is useful
str(Politics.df)
# explore data #2 - simple plots
library(ggplot2)
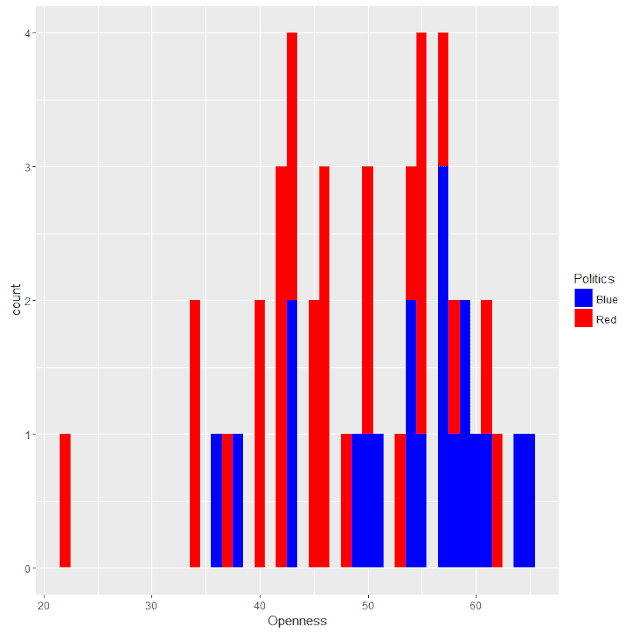
# plot openness
plot.openness <- ggplot(Politics.df, aes(x = Openness, fill = Politics))
plot.openness.histo <- plot.openness + geom_histogram(binwidth = 1)
plot.openness.histo + scale_fill_manual(values = c("Red" = "red", "Blue" = "blue"))
 # plot conscientiousness
plot.conscientiousness <- ggplot(Politics.df, aes(x = Conscientiousness, fill = Politics))
plot.conscientiousness.histo <- plot.conscientiousness + geom_histogram(binwidth = 1)
plot.conscientiousness.histo + scale_fill_manual(values = c("Red" = "red", "Blue" = "blue"))
# plot conscientiousness
plot.conscientiousness <- ggplot(Politics.df, aes(x = Conscientiousness, fill = Politics))
plot.conscientiousness.histo <- plot.conscientiousness + geom_histogram(binwidth = 1)
plot.conscientiousness.histo + scale_fill_manual(values = c("Red" = "red", "Blue" = "blue"))
 # set working data set
Politics.training <- Politics.df
# create subsets
Politics.predictors <- Politics.training[, 4:6]
Politics.predicted <- Politics.training[, 12]
# review subsets - I used this to troubleshoot code issues
# the svm function needs matrices, and I was incorrectly giving it lists
str(Politics.predictors)
str(Politics.predicted)
# load library for SVM
library(e1071)
# train
Politics.svm <- svm(data = Politics.training, Politics ~ Openness + Conscientiousness)
# review results
summary(Politics.svm)
# generate predict
Politics.prediction <- predict(Politics.svm, Politics.predictors)
# combine predictions with actual
table(Politics.prediction, Politics.predicted)
# plot results
plot(Politics.svm, Politics.training, Openness ~ Conscientiousness)
# set working data set
Politics.training <- Politics.df
# create subsets
Politics.predictors <- Politics.training[, 4:6]
Politics.predicted <- Politics.training[, 12]
# review subsets - I used this to troubleshoot code issues
# the svm function needs matrices, and I was incorrectly giving it lists
str(Politics.predictors)
str(Politics.predicted)
# load library for SVM
library(e1071)
# train
Politics.svm <- svm(data = Politics.training, Politics ~ Openness + Conscientiousness)
# review results
summary(Politics.svm)
# generate predict
Politics.prediction <- predict(Politics.svm, Politics.predictors)
# combine predictions with actual
table(Politics.prediction, Politics.predicted)
# plot results
plot(Politics.svm, Politics.training, Openness ~ Conscientiousness)


Comments
Post a Comment