Posts

Showing posts from 2017

Review: Complex Adaptive Systems: An Introduction to Computational Models of Social Life

Image
Complex Adaptive Systems: An Introduction to Computational Models of Social Life by John H. Miller My rating: 4 of 5 stars A thought-provoking introductory exploration to modeling social systems, covering ideas for rule-based agents within a variety of rule-based systems, moving onto evolutionary-like automata and organization of agents to solve problems. Underlying some of the ideas, one could see references to deeper concepts, e.g., nonlinearity, attractors, emergence, and complexity, none of which was explained explicitly. At times, I did find the writing tedious, as some ideas were too obvious to spend time detailing, but overall, a well-written easy to digest text. View all my reviews

My Most Popular Posts of 2017

Image
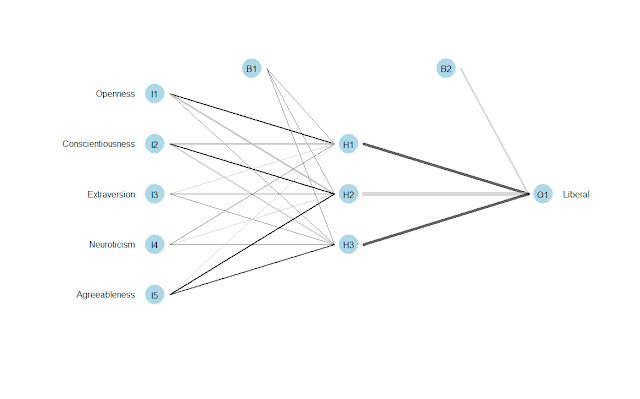
Although I've made many posts on my Data Analytics Workouts site, some generated more interest than others - nothing here was virally popular - and below are a handful of the most popular, sorted in descending order of views: Charting Correlation Matrices in R (877) Neural Networks (Part 4 of 4) - R Packages and Resources (507) Performance Improvements in R: Vectorization & Memoisation (322) Naive Bayes on Political Outcome Based on State-level Big Five Assessment (263) Decision Trees on Political Outcome Based on State-level Big Five Assessment (262) F# is Part of Microsoft's Data Science Workloads (223) Logistic Regression on Stock Data using Google and SPY (SPDR S&P 500) (196) Using Visual Studio Team Services for Personal Development (194) Microsoft Azure Notebooks - Live code - F#, R, and Python (186) Efficient R Programming - A Quick Review (178) Patents Per Capita and Hofstede's Cultural Dimensions (167) Comparing Performance in R Usin

Software engineers will be obsolete by 2060

In response to an article on Medium, Software engineers will be obsolete by 2060 , I responded with the following : Interesting article on The Economist titled Automation on Automation Angst, http://www.economist.com/node/21661017, that looks at several publications that look at the historical effects of automation, and although there is always a fear of being replaced, ultimately more jobs are created than destroyed. Software engineers disappear? So what! There will be other jobs, with different titles, and in the interim, the more people use tech, the more there will be a need for software engineers. Because of this, a person asked for my opinion on maintaining their career as a .NET developer, to which I responded : Although I am a .NET developer as well, I focus on expanding my project management and leadership skills, as well as developing skills in AI/ML. Rather than bore with all the details of my background, here is what I think: You should develop your skills in AI/ML,

Using Visual Studio Team Services for Personal Development

Image
Overview Microsoft provides free access to its online Visual Studio Team Services (VSTS) , and for some time I've been using the service, I've wanted to restructure my code hierarchy, and recent changes in my work environment, automated build and deployment using Octopus, nudged me to finally take the task on, so in the past few weeks I've: Restructured my Code library into one big project with sub-projects for Development, Websites, and Work Developed my Work hierarchy of Epics, Features, Stories and Tasks, along with queries and sprint boards Automated all of my builds via check-in, adding extensions to evaluate code and build quality Developed a dashboard to oversee the status of work Code Library I was frustrated with the limitations of working with my code library, and after reading opinions on best practices, I settled on one big project for my code, which I assumed would make it easier to manage my time and energy, and give me a global view of my individu

Code: Pinterest as a Publication Channel for Data Analytics

Image
More as an experiment, rather an attempt at sharing code and ideas, I created a Pinterest board devoted to my personal data analytics work, done with Python, R, or F#, as well as reviews of books, and was quite surprised with the result. The graphics could do with optimization, but otherwise...

Deep Learning and Toolkits

Image
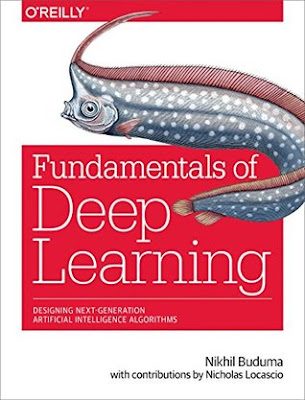
As part of reading Fundamentals of Deep Learning: Designing Next-Generation Machine Intelligence Algorithms by Nikhil Buduma , I was expecting to work through some of the code examples with my own data, and for the examples, it recommended TensorFlow , which brings up competing alternatives, a primary one being Microsoft Cognitive Toolkit . Over the next few weeks, I will start exploring both in Python, as well as publishing some of the related work. A minor note, the darksigma/Fundamentals-of-Deep-Learning-Book: Code companion to the O'Reilly "Fundamentals of Deep Learning" book is available on GitHub.

Principal Component Analysis (PCA) on Stock Returns in R

Image
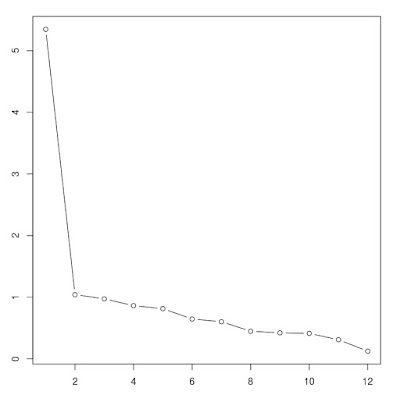
Principal Component Analysis Principal Component Analysis is a statistical process that distills measurement variation into vectors with greater ability to predict outcomes utilizing a process of scaling, covariance, and eigendecomposition. MS Azure Notebook The work for this is done in the following notebook, Principal Component Analysis (PCA) on Stock Returns in R , with detailed code, output, and charts. An outline of the notebook contents are below. Overview of Demonstration Supporting Material Pluralsight Explained Visually Wikipedia Load Data: Format Data & Sort Prep Data: Create Returns Generate Principal Components Eigen Decomposition and Scree Plot Create Principal Components Analysis FVX using PCA versus Logistic Regression Alternative Libraries: Psych for the Social Sciences

Exercises in Programming Style by Cristina Videira Lopes

Exercises in Programming Style by Cristina Videira Lopes My rating: 5 of 5 stars An easily consumed, enjoyable read, and excellent review of the history of programming style, from older days of constrained memory and monolithic styles, through pipelining and object-oriented variants, to more recent patterns like model-view-controller (MVC), mapreduce, and representational state transfer (ReST). Along the way, each variant is described, along with its constraints, its history, and its context in systems design. View all my reviews

Data Mining for Fund Raisers: How to Use Simple Statistics to Find the Gold in Your Donor Database Even If You Hate Statistics: A Starter Guide

Image
This is a repost of a Goodreads' review I made in 2013, for a book I read in 2005, which seems relevant now, as the industry is adding a data-driven focus. Plus, the world is now being transformed by advances in artificial intelligence and machine learning (AI/ML), particularly deep learning, and the large data sets and complexity of donor actions should greatly benefit from analysis. Note, the tax changes for 2018 and beyond will increase the importance of major donors, attenuating the benefits of AI/ML, as data for high-net-worth individuals is sparse. Data Mining for Fund Raisers: How to Use Simple Statistics to Find the Gold in Your Donor Database Even If You Hate Statistics: A Starter Guide by Peter B. Wylie My rating: 4 of 5 stars My spouse, at times a development researcher of high-net worth individuals, was given this book because she was the 'numbers' person in the office. Since my undergraduate was focused on lab-design, including analysis of results using

Value-at-Risk (VaR) Calculator Class in Python

Image
As part of my self-development, I wanted to rework a script, which are typically one-offs, and turn it into a reusable component, although there are existing packages for VaR. As such, this is currently a work in progress. This code is a Python-based class for VaR calculations , and for those unfamiliar with VaR, it is an acronym for value at risk, the worst case loss in a period for a particular probability. It is a reworking of prior work with scripted VaR calculations , implementing various high-level good practices, e.g., hiding/encapsulation, do-not-repeat-yourself (DRY), dependency injection, etc. Features: Requires data frame of stock returns, factor returns, and stock weights Expose a method to calculate and return a single VaR number for different variance types Expose a method to calculate and return an array of VaR values by confidence level Expose a method to calculate and plot an array of VaR values by confidence level Still to do: Dynamic factor usage Note

Calculating Value at Risk (VaR) with Python or R

Image
The following modules linked below are based on a Pluralsight course, Understanding and Applying Financial Risk Modeling Techniques , and while the code itself is nearly verbatim, this is mostly for my own development, working through the peculiarities of Value at Risk (VaR) in both R and Python, and adding commentary as needed. The general outline of this process is as follows: Load and clean Data Calculate returns Calculate historical variance Calculate systemic, idiosyncratic, and total variance Develop a range of stress variants, e.g. scenario-based possibilities Calculate VaR as the worst case loss in a period for a particular probability The modules: In R: Financial Risk - Calculating Value At Risk (VaR) with R In Python: Financial Risk - Calculating Value At Risk (VaR) with Python

Review: Make Your Own Neural Network

Image
As part of understanding neural networks I was reading Make Your Own Neural Network by Tariq Rashid. A review is below: Make Your Own Neural Network by Tariq Rashid My rating: 4 of 5 stars The book itself can be painful to work through, as it is written for a novice, not just in algorithms and data analysis, but also in programming. For the neural network aspect, it jumped between overly simplistic and complicated, while providing neither in enough detail. That said, by the end I found it a worthwhile dive into neural networks, since once it got to the programming structure, it all made sense, but only because I stuck with it. View all my reviews

Basic Three Layer Neural Network in Python

Image
Introduction As part of understanding neural networks I was reading Make Your Own Neural Network by Tariq Rashid. The book itself can be painful to work through, as it is written for a novice, not just in algorithms and data analysis, but also in programming. Although the code is a verbatim transcription from the text (see Source section), I published it to better understand how neural networks are designed, made easy by the use of a Jupyter Notebook, not to present this as my own work, although I do hope that this helps others develop their talents with data analytics.  Github Source:  AzureNotebooks/Basic Three Layer Neural Network in Python.ipynb at master · JamesIgoe/AzureNotebooks (github.com) Overview The code itself develops as follows: Constructor set number of nodes in each input, hidden, output layer link weight matrices, wih and who weights inside the arrays are w_i_j, where link is from node i to node j in the next layer set learning rate activation funct

Clustering: Hierarchical and K-Means in R on Hofstede Cultural Patterns

Image
Overview What follows is an exploration of clustering, via hierarchies and K-Means, using the Hofstede patterns data, available from my Public folder . For a deeper understanding of clustering and the various related techniques I suggest the following: Cluster analysis (Wikipedia) An Introduction to Clustering and different methods of clustering Load Data # load data Hofstede.df.preclean <- read.csv("HofstedePatterns.csv", na.strings = c("", "NA")) #nrow(Hofstede.df.preclean) # remove NULLs Hofstede.df.preclean <- na.omit(Hofstede.df.preclean) #nrow(Hofstede.df.preclean) Hofstede.df <- Hofstede.df.preclean Hierarchical Clustering Run hclust, Generate Dendrogram The first attempt is the simplest analysis using the dist() and hclust() functions to generate a hierarchy of grouped data. The cluster size is derived from a reading of the dendrogram, although there are automated ways of selecting the cluster

F# is Part of Microsoft's Data Science Workloads

Image
I have not worked in F# for over two (2) years, but am enthused that Microsoft has added it to it languages for Data Science Workloads, along with R and Python. To that end, I hope to repost some of my existing F# code, as well as explore Data Science Workloads utilizing all three languages. Prior work in F# is available from learning F# , and some solutions will be republished on this site. Data Science Workloads Build Intelligent Apps Faster with Visual Studio and the Data Science Workload Published Work in F# James Igoe MS Azure Notebooks that utilizes MS's implementation of Jupyter Notesbooks . Mathematical Library, a basic mathematical NuGet package, with the source hosted on GitHub . Basic Statistical Functions: Very basic F# class for performing standard deviation and variance calculations. Various Number Functions: A collection of basic mathematical functions written in F# as part of my learning via Project Euler, functions for creating arrays or calc

Comparing Performance in R Using Microbenchmark

Image
This post is a very simple display of how to use microbenchmark in R . Other sites might have longer and more detailed posts , but this post is primarily to 'spread the word' about this useful function, and show how to plot it. An alternative version of this post exists in Microsoft's Azure Notebooks, as Performance Testing Results with Microbenchmark Load Libraries Memoise as part of the code to test, microbenchmark to show usage, and ggplot2 to plot the result. library(memoise) library(microbenchmark) library(ggplot2) Create Functions Generate several functions with varied performance times, a base function plus functions that leverage vectorization and memoisation. # base function monte_carlo = function(N) { hits = 0 for (i in seq_len(N)) { u1 = runif(1) u2 = runif(1) if (u1 ^ 2 > u2) hits = hits + 1 } return(hits / N) } # memoise test function monte_carlo_memo <- memoise(mon

Pluralsight Courses - Opinion

My list is kind of paltry, but I’ve sat through others or started many but decided against finishing. The best courses I’ve finished have been along the lines of project management: Project Management for Software Engineers Project 2013 Fundamentals for Business Professionals I’ve also sat through this, and useful, although very rudimentary: Creating and Leading Effective Teams for Managers I do my own reading for data science, and have my own side projects, but I’ve also taken some data science courses via Pluralsight. The beginner demos are done well, although less informative than the intermediate ones, which are ultimately more useful. For the latter, I typically do simultaneous coding on my own data sets, which helps learn the material. Beginner Understanding Machine Learning Understanding Machine Learning with R Intermediate Understanding and Applying Logistic Regression (using Excel, Python, or R) Data Mining Algorithms in SSAS, Excel, and R

ARIMA,Time Series, and Charting in R

Image
ARIMA is an acronym for Autoregressive Integrated Moving Average, and one explanation describes ARIMA models as... ...another approach to time series forecasting. Exponential smoothing and ARIMA models are the two most widely-used approaches to time series forecasting, and provide complementary approaches to the problem. While exponential smoothing models were based on a description of trend and seasonality in the data, ARIMA models aim to describe the autocorrelations in the data. A detailed technical discussion can be found on Wikipedia. For the first exploration I developed several ARIMA models using financial data, varying the parameters, noted as P, D and Q. A general overview of the parameters is from Wikipedia: p is the order (number of time lags) of the autoregressive model d is the degree of differencing (the number of times the data have had past values subtracted) q is the order of the moving-average model # filtered to start on a date Portfolio.filtere

Geert Hofstede | Defined Corporate Culture

I've been interested in Hofstede's work since B-school, back in the early second millennia, and at one time considered publishing using his country characteristics as predictors for economic and social welfare outcomes. Nowadays, I use the results of his analyses frequently in small R programming demonstrations. He's an interesting researcher, who's done important work, as The Economist article describes : The man who put corporate culture on the map—almost literally—Geert Hofstede (born 1928) defined culture along five different dimensions. Each of these he measured for a large number of countries, and then made cross-country comparisons. In the age of globalisation, these have been used extensively by managers trying to understand the differences between workforces in different environments. The Economist article give a fuller picture of Geert Hofstede , and anyone interested in reading one of his works might enjoy Cultures and Organizations: Software of the Mi

Microsoft Azure Notebooks - Live code - F#, R, and Python

I was exploring Jupyter notebooks , that combines live code, markdown and data, through Microsoft's implementation, known as MS Azure Notebooks , putting together a small library of R and F# notebooks . As Microsoft's FAQ for the service describes it as : ...a multi-lingual REPL on steroids. This is a free service that provides Jupyter notebooks along with supporting packages for R, Python and F# as a service. This means you can just login and get going since no installation/setup is necessary. Typical usage includes schools/instruction, giving webinars, learning languages, sharing ideas, etc. Feel free to clone and comment... In R Azure Workbook for R - Memoisation and Vectorization Charting Correlation Matrices in R In F# Charnownes Constant in FSharp.ipynb Project Euler - Problems 18 and 67 - FSharp using Dynamic Programming

Efficient R Programming - A Quick Review

Image
Efficient R Programming: A Practical Guide to Smarter Programming by Colin Gillespie My rating: 5 of 5 stars Simply a great book, chock full of tips and techniques for improving one's work with R. View all my reviews

Performance Improvements in R: Vectorization & Memoisation

Image
Full of potential coding improvements, Efficient R Programming: A Practical Guide to Smarter Programming , the book makes two suggestions that are notable. Vectorization, explained here and here , and memoisation , caching prior results albeit with additional memory use, were relevant and significant. What follows is a demonstration of the speed improvements that might be achieved using these concepts. ################################ # performance # vectorization and memoization ################################ # clear memory between changes rm(list = ls()) #load memoise #install.packages('memoise') library(memoise) # create test function monte_carlo = function(N) { hits = 0 for (i in seq_len(N)) { u1 = runif(1) u2 = runif(1) if (u1 ^ 2 > u2) hits = hits + 1 } return(hits / N) } # memoise test function monte_carlo_memo <- memoise(monte_carlo) # vectorize function monte_carlo