Using Visual Studio Team Services for Personal Development
Overview
Microsoft provides free access to its online Visual Studio Team Services (VSTS), and for some time I've been using the service, I've wanted to restructure my code hierarchy, and recent changes in my work environment, automated build and deployment using Octopus, nudged me to finally take the task on, so in the past few weeks I've:
Code Library
I was frustrated with the limitations of working with my code library, and after reading opinions on best practices, I settled on one big project for my code, which I assumed would make it easier to manage my time and energy, and give me a global view of my individual projects.

Work Structure
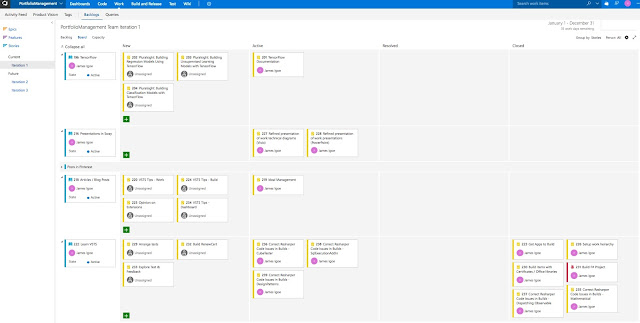
Being fairly familiar with agile concepts of kanban and scrum, in particular implementing those with Jira, I went about planning a hierarchy of work, with top-level epics for my code hierarchy, as well as managing overall, both code, self-development and blog publication. One extension that might be useful when developing the board is Work Item Visualization that enables one to see the relationship between work items.
Automated Builds
Getting this to work correctly took some effort, with code fixes needed for my older projects.

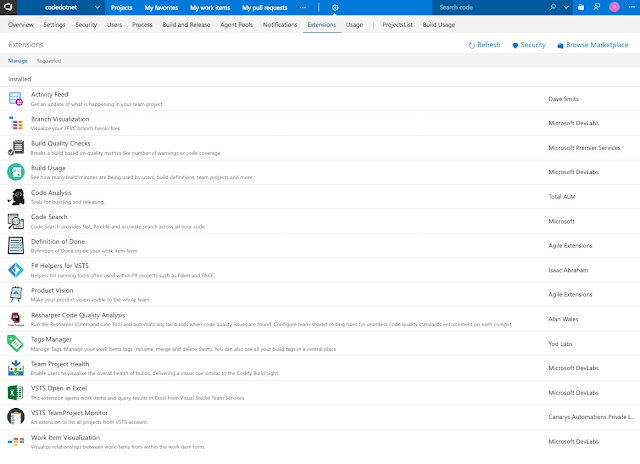
In addition, I added the Resharper Code Quality Analysis as well as MS's Build Quality Checks extensions to improve the quality of my code.
Dashboard
Once the other sections were set up, it was easier to build out the dashboard, since I now had actual work to monitor. That said, there were several extensions I found useful for display and querying:

Microsoft provides free access to its online Visual Studio Team Services (VSTS), and for some time I've been using the service, I've wanted to restructure my code hierarchy, and recent changes in my work environment, automated build and deployment using Octopus, nudged me to finally take the task on, so in the past few weeks I've:
- Restructured my Code library into one big project with sub-projects for Development, Websites, and Work
- Developed my Work hierarchy of Epics, Features, Stories and Tasks, along with queries and sprint boards
- Automated all of my builds via check-in, adding extensions to evaluate code and build quality
- Developed a dashboard to oversee the status of work
Code Library
I was frustrated with the limitations of working with my code library, and after reading opinions on best practices, I settled on one big project for my code, which I assumed would make it easier to manage my time and energy, and give me a global view of my individual projects.
- Development: Personal projects in AI, ML, statistics, design patterns, and algorithms, written in C#, Python, F#, or R
- Websites: My public facing sites, created using PHP/HTML/CSS/Javascript or ASP.NET using C# and VB.NET

Work Structure
Being fairly familiar with agile concepts of kanban and scrum, in particular implementing those with Jira, I went about planning a hierarchy of work, with top-level epics for my code hierarchy, as well as managing overall, both code, self-development and blog publication. One extension that might be useful when developing the board is Work Item Visualization that enables one to see the relationship between work items.

Automated Builds
Getting this to work correctly took some effort, with code fixes needed for my older projects.

In addition, I added the Resharper Code Quality Analysis as well as MS's Build Quality Checks extensions to improve the quality of my code.

Dashboard
Once the other sections were set up, it was easier to build out the dashboard, since I now had actual work to monitor. That said, there were several extensions I found useful for display and querying:


Comments
Post a Comment