Principal Component Analysis
Principal Component Analysis is a statistical process that distills measurement variation into vectors with greater ability to predict outcomes utilizing a process of scaling, covariance, and eigendecomposition.
MS Azure Notebook
The work for this is done in the following notebook,
Principal Component Analysis (PCA) on Stock Returns in R, with detailed code, output, and charts. An outline of the notebook contents are below.
Overview of Demonstration
- Supporting Material
- Load Data: Format Data & Sort
- Prep Data: Create Returns
- Generate Principal Components
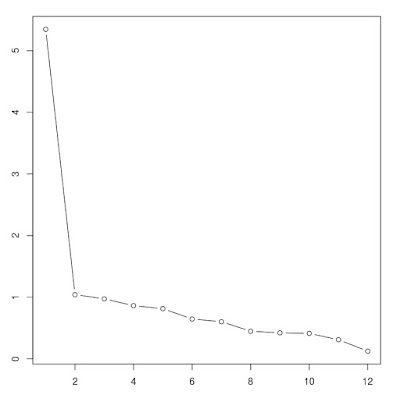
- Eigen Decomposition and Scree Plot
- Create Principal Components
- Analysis
- FVX using PCA versus Logistic Regression
- Alternative Libraries: Psych for the Social Sciences


Comments
Post a Comment